Z80 Explorer is a visual netlist-level simulator for the Zilog Z80 microprocessor. You can read more about it in my main blog article. This release adds some features and improvements I felt were missing as I deep-dived into the chip’s functioning.
This post aims to clarify several more interesting changes and to supplement the app’s user guide document. Please read that document first; all the changes pertinent to this release have been marked with “(v1.06)” so you can quickly find them.
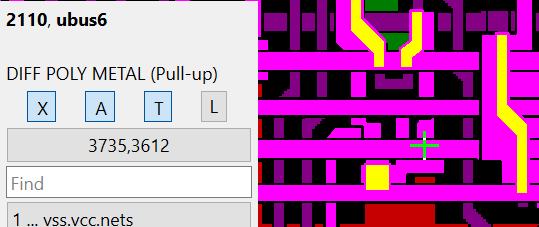
One of the first improvements you will notice as you move your mouse across the chip layout is more information about a specific point on the die.
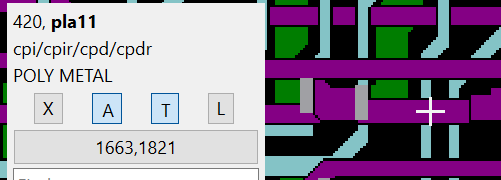
On the top of the image overlay area the app now displays the active nets and transistors in bold. The third line, also added, shows the stack of layers and features at the selected location. Given that the chip technology is NMOS, the possible layer options are combinations of diffusion, polysilicon, and metal, as well as vias, buried contacts, and ion implantations. If there is a transistor or a pull-up at this place, the text will also show “(Tran)” and “(Pull-up)” next to it.
There are now several ways to draw transistors. The button “T” will still turn them on and off completely, but when they are on, a period key “.” will cycle through the four modes: “Active” transistors and “All” are self-explanatory, while “Single-Flip” and “Sticky” may need some explanation.
Say you want to find out where a flop that holds the IM state is. You’d create a Z80 test code that issues IM0, IM1, and IM2 instructions. You know the CPU resets in IM0, so you single cycle step through issuing of IM1, with a couple of NOPs around it. You want to find which transistor(s) changed state only once. Before issuing IM1, you prepare the app by pressing “T” twice (to turn the transistors off and back on), which sets it up and clears the internal transistor counters. Switch to “Single-Flip” mode and step through the Z80 code. Transistors will light up as they change state, but all those that change state again will permanently dim. Repeat the same with the IM2 test code, and you can determine which flops hold those states within the CPU.
This option should help you figure out the rest of the bits that hold various states, such as flags, etc.
“Sticky” mode is similar, but any transistor that changes state one or more times will be permanently lit. This helps you identify transistors that were somehow triggered but have returned to their previous state after that.
The following improvement deals with graphically better showing the structure of a wire. Previously, all nets were flattened like this:
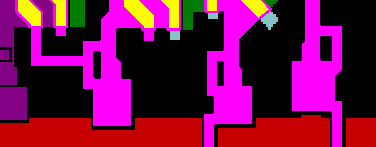
Pressing Shift+X now shows the exact structure of these pull-ups:
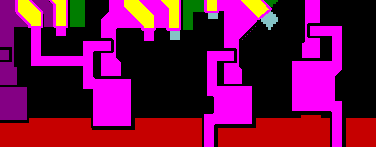
Individual nets can cross each other or even run in parallel (one can be using a polysilicon lead and another metal trace going on top of it), when one may obscure another. As the app draws them, sometimes it is hard to tell them apart. For example, the following picture shows a pull-up and all possible (for NMOS) layers being used:
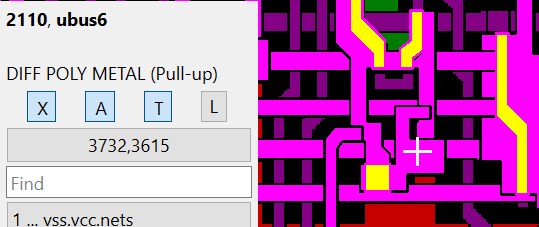
The following image shows the reversed order of the nets drawn. Here, you can clearly see the horizontal metal traces going over the pull-up feature:
Key “Z” toggles the order of drawing the nets. Shift + “Z” turns on auto-toggle by using an internal timer.
As I was using the app, and in a waveform window, as the execution kept filling up the view with the waveform data and disappearing past the right edge, I had to scroll it constantly. So, I added a feature for the waveform to start auto-scrolling if it hits an active cursor.

This is better described in the documentation, but I felt it would also be helpful to mention it here.
Finally, a couple of new hotkey commands are handled with scripting (see “init.js” file): “F7” and “F8” step the execution by a half-cycle and by a complete cycle (two half-cycles). CTRL + “F7” and “F8” pseudo-step back by the same number of cycles. It is “pseudo” because the script restarts the execution (also doing the reset sequence in between) and then stops at the point before the current time. This has, by large, the same effect as stepping back (at this time, the app does not have the ability to truly step back by restoring some state). Still, it is useful to step back in some instances.
The app has powerful scripting built in. Its JavaScript interpreter is tightly integrated with a few of the app’s internal functions. See “init.js” file in the resource directory. This version adds a keypress callback into the function “key()”. You can add your key-code handlers and issue script commands.
|
1 2 3 4 5 6 7 8 9 10 11 12 13 14 15 16 17 18 19 20 21 22 23 24 25 26 27 28 29 30 31 32 33 34 35 36 37 38 39 40 41 42 43 44 45 |
// Callback for keys that are not handled by the image view // You can show the values of (code,ctrl) if you hold down the Alt key while pressing a key combination in question function key(code, ctrl) { // Few useful image layer presets if (code == 33) // key "1" shifted, '1' on a US keyboard layout { setLayer("3"); addLayer("4"); addLayer("5"); addLayer("6"); addLayer("7"); } if (code == 64) // key "2" shifted, '@' on a US keyboard layout { setLayer("3"); addLayer("4"); addLayer("6"); addLayer("7"); } if (code == 35) // key "3" shifted, '#' on a US keyboard layout { setLayer("a"); addLayer("b"); addLayer("d"); addLayer("e"); } //------------------------------------------------------------------------------- // F7 - run 1 half cycle forward if ((code == 0x1000036) && (ctrl == 0)) run(1); // F8 - run 2 half cycles forward if ((code == 0x1000037) && (ctrl == 0)) run(2); // Ctrl + F7 - run 1 half cycle back (by reset and rerun) if ((code == 0x1000036) && (ctrl == 1)) { cycle = mon.getHCycle(); if (cycle >= 10) { reset(); run(cycle - 9); } } // Ctrl + F8 - run 2 half cycles back (by reset and rerun) if ((code == 0x1000037) && (ctrl == 1)) { cycle = mon.getHCycle(); if (cycle >= 11) { reset(); run(cycle - 10); } } } |
As the code above shows, three new image layer combinations are added as quick presets. They can be activated by pressing Shift + “1”, “2”, or “3”.
The simulation engine has also been slightly improved: on my i7-13700K PC desktop I am getting around 4200Hz execution speed. My pipedream is to find a silver bullet simulation code that would run it at its native 3.5MHz frequency. That is only 1000 times faster.
Although this app is very niche, thank you for the wonderful feedback I received!
The app is open-source, and you can download a pre-built version for Windows here: Releases · gdevic/Z80Explorer.
Hi Goran, congrats on the new release! Its new features look awesome!
For anyone who creates Z80 hardware or software simulators (like me), or for anyone simply interested in learning how the Z80 operates internally, Z80 Explorer is the best tool by far. It’s invaluable, given the lack of published technical documentation on the Z80’s internals.
I’m looking forward to playing around with this new release!